
Wobbly Life: Mission Island Stats!
A fishing festival, a bucket full of fish and towers of crates: five missions take you from a messy list of catches to a graph everyone understands. Can you become the stats champion?
What you practise
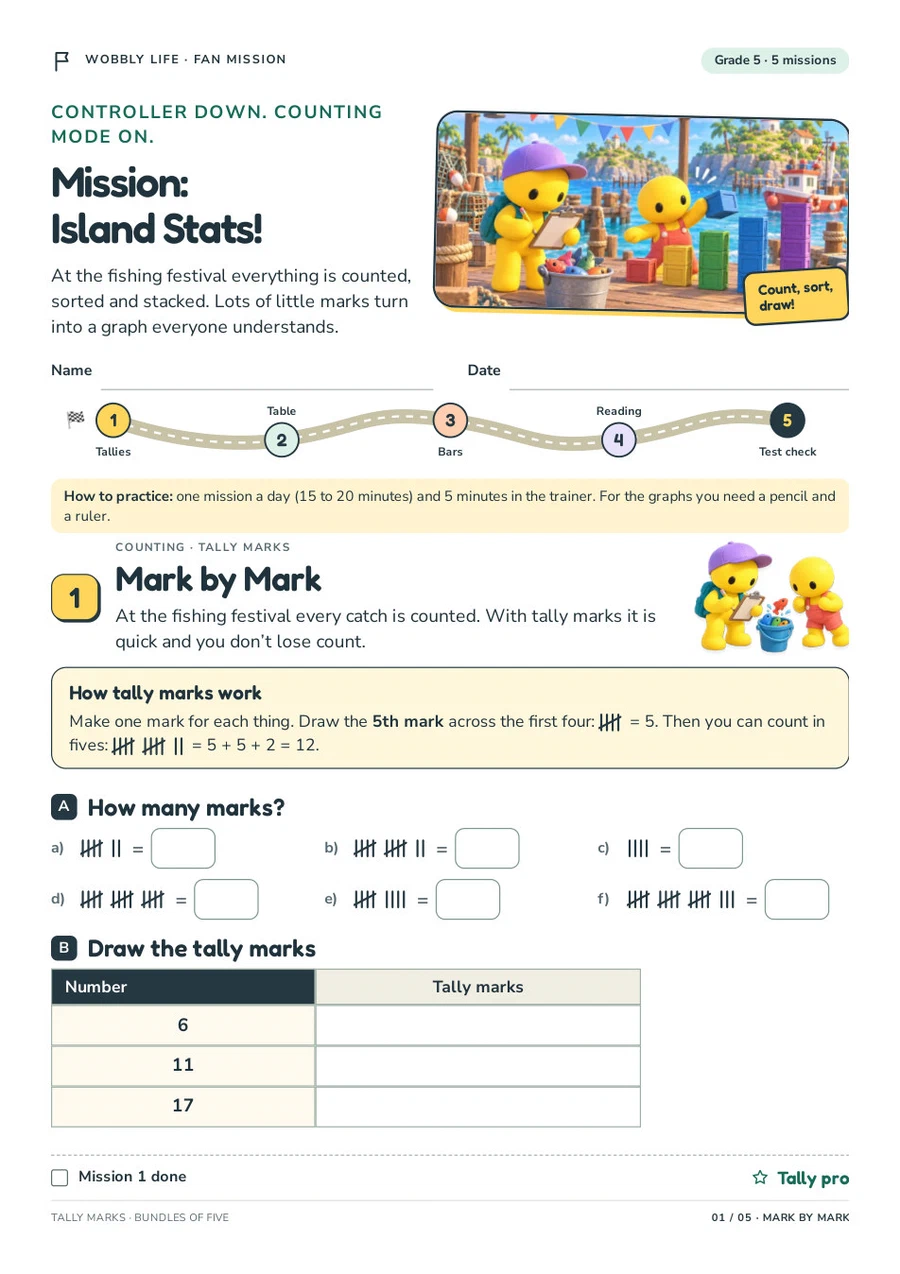
- Tally marks: reading and drawing tallies with bundles of five.
- Raw data and frequency table: count 36 catches, fill in the table and answer questions about it.
- Drawing bar graphs: number the axis, label the bars, add a title, and choose a fitting scale yourself (including half squares).
- Reading graphs: a bar graph with a scale, a horizontal bar graph and a picture graph where one picture stands for 10.
- Test check: a short raw-data count, an error detective with one wrong bar and a traffic-light self-check.
In the pack: five A4 mission pages (one mission a day, about 15 to 20 minutes each) and one page of answers with typical mistakes and tips for grown-ups. Every page comes in English (US) and German.
Interactive version: check every answer in your browser, in English or German. It includes tallies you can mark with + and −, bar graphs you draw by tapping, and a graph trainer for reading tally marks, bars, differences and picture graphs, with a hint for every mistake and a 10-problem test. The page contains its own images and fonts and works offline; answers are saved only in your browser and never sent anywhere.
This pack is one of five topic packs that go together: times tables to 20, square numbers, tally charts and bar graphs, ordering numbers and rounding. For a mixed review of all five topics, try Mission Number Island.
For printing, use A4 at 100%. Keep the answer key separate until the missions are done.